Technology for agriculture and agribusiness in Brazil's Northeast.
We build software, forecasting models and data integration for sugar mills, irrigated fruit growing, cooperatives, livestock and grains. Built for operations in the Northeast, where almost all cane is cut by hand and rain is concentrated in a few months. The company was founded in Recife by two software engineers from UFPE.
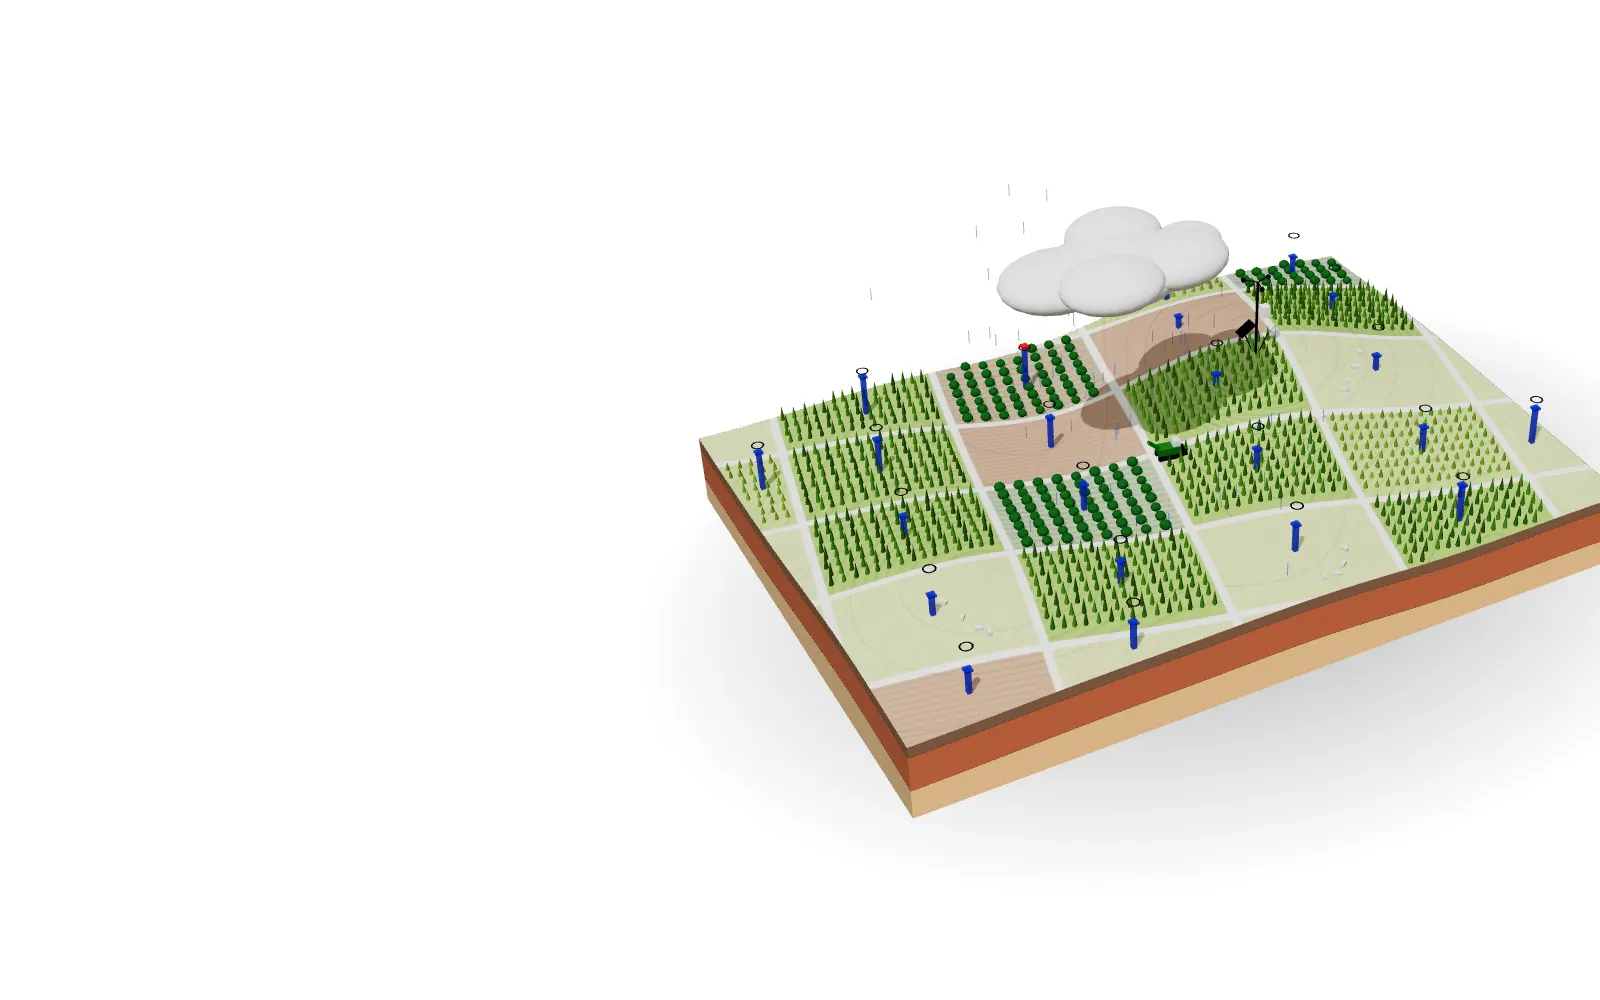
- Cleared to operate
- Non-workable
- Soil moisture
Illustrative simulation: the blue column is soil moisture; above the black ring, no machine goes in.
Where we work
We work with the main production chains of the region. In every one of them, the starting point is the data the operation already records.
-
Crushing runs 24 hours a day during the season and depends on cane arriving at the right pace. In Pernambuco, almost all cane is cut by hand, on slopes. Rain stops cutting and transport, the available cane runs out, and cut cane left waiting loses sugar.
- Average annual rainfall
- 1,500 mm
- Cultivated area
- 526 thousand ha cane in PE and AL
JFMAMJJASONDHeaviest rainSeason and crushingPayment for growers' caneRecommended products Agnaris ClimaAgnaris PerdasAgnaris CampoAgnaris Fornecedor
-
With irrigation and floral induction, mango and grape are produced year-round. The induction date sets the harvest, and the harvest has to line up with the price window, the destination and the shipment. Rain at harvest brings anthracnose in mango and cracking in grape.
- Average annual rainfall
- 550 mm
- Cultivated area
- 120 thousand ha irrigated area
JFMAMJJASONDRain in the semiarid regionHarvest scheduled by lotMain export windowRecommended products Agnaris ClimaAgnaris PerdasAgnaris Fornecedor
-
Rain arrives at different times: in the Sertão, from February to April; in the Agreste, from April to July. How feed and water reserves are planned decides how the herd gets through the dry season, and the dairy feels the drought in the volume and quality of the milk it receives.
- Average annual rainfall
- 650 mm
- Cultivated area
- 550 thousand ha forage cactus (estimate)
JFMAMJJASONDRain in the SertãoRain in the AgresteDry season: reserve feedQuality-based milk paymentRecommended products Agnaris ClimaAgnaris PerdasAgnaris Fornecedor
-
Large areas, short windows. Sowing depends on the rains settling within the official calendar and the risk zoning, and the order in which blocks are harvested determines losses, queues at the warehouse and drying.
- Average annual rainfall
- 1,200 mm
- Cultivated area
- 2,750 thousand ha soy, cotton and corn
JFMAMJJASONDRainy seasonSoybean sowingSoybean harvestCotton harvestRecommended products Agnaris ClimaAgnaris PerdasAgnaris Fornecedor
-
Cooperatives and associations bring together hundreds or thousands of producers who deliver cane, milk, fruit or grain to a processor. They need to check that each one is paid fairly for the quality delivered, and to forecast how much and when each one will deliver.
JFMAMJJASONDReceiving and paying for deliveriesRecommended products Agnaris FornecedorAgnaris PerdasAgnaris Clima
From the field to the decision
An example of how a field reading reaches the manager as a recommendation.
- Station T-14
- Weighbridge 2
- Laboratory
- Crushing
| Time | Source | Variable | Value |
|---|---|---|---|
| 05:40 | T-14 | Rain 24 h | 18.0 mm |
| 05:40 | T-14 | Moisture 30 cm | 27 % |
| 05:12 | Weighbridge 2 | Load 4471 | 31.8 t |
| 04:58 | Laboratory | ATR | 138.4 kg/t |
| 00:00 | Plant | Crushing 24 h | 11,870 t |
Bring forward the cutting on farms 12 and 14
Heavy rain starting Thursday: 2 days with cutting stopped. Farms 12 and 14 drain better and can be cut until Wednesday.
Keep available cane at 20 h of crushing.
See harvest plan- 1. Field
The sensor measures
At 5:40 a.m., the station in block 14 records 18 mm of rain in 24 h. The sensor at 30 cm reads 27% moisture.
- 2. Database
The data is organized
The reading goes into the same database as the weighbridge, the laboratory and the crushing history, with date, location and unit checked.
- 3. Model
It becomes a forecast
The model combines the forecast rain with the soil and terrain of each farm: 2 days with cutting stopped starting Thursday.
- 4. Decision
It arrives as a recommendation
The manager gets it on the phone: bring forward the cutting on farms 12 and 14, which drain better, keep available cane at 20 h of crushing and clean the milling train on the rainy day.
- Illustrative example of an operating day.
Platform
Three products, which can be contracted together or separately.
-
Agnaris Clima
Rain and calendar turned into operating decisions.
AnswersOn which days will the rain stop the field, and what should be done before it?
Learn about Agnaris ClimaIllustrative - Uses
- Rain gauges and weather stations of the operation
- Numerical weather forecasts
- Stoppage and production history
- Soil and terrain of each farm
- Delivers
- Days of stopped operation by farm or front, over the next 7 days
- What to bring forward, hold back or schedule before the rain
-
Agnaris Perdas
Where the operation loses raw material and sugar, from the field to the plant.
AnswersHow much is lost between the field and the plant, at what stage and why?
Learn about Agnaris PerdasIllustrative - Uses
- Burning, harvest and transport records
- Weighbridge and laboratory
- Plant bulletin and systems
- Map of the source areas
- Delivers
- Time and quality loss by front, lot or route
- Balance by stage and shift, with the unaccounted loss
- Meters out of calibration and calculated values where there is no measurement
-
Agnaris Campo
Field records on the phone, with or without internet.
AnswersWhat happened on each front today, and at what time?
Learn about Agnaris CampoIllustrative - Uses
- Field team phones, with or without signal
- List of farms, fronts and blocks
- Rain gauges and trucks of the operation
- Cutting, harvest or collection orders
- Delivers
- Burning, cutting, harvest and loading with time and place
- Rain gauge readings on the same day
- Data ready for Clima and Perdas
-
Agnaris Fornecedor
Payment for quality checked load by load.
AnswersDoes what was paid to each supplier match the weight and quality of what they delivered?
Learn about Agnaris FornecedorIllustrative - Uses
- Weight and analysis of each load or collection
- Payment rules: Consecana, the dairy's or the packing house's table
- Register of suppliers and areas
- Production costs by region
- Delivers
- Payment checked load by load
- Out-of-range analyses flagged for follow-up
- Simulation of the amount to be received and comparison with cost
What a day of downtime costs your operation
Enter your operation's capacity and revenue. The calculation and its assumptions appear below the result.
-
24h per day
is how long a sugar mill crushes during the season. Part of a stopped hour is recovered by lengthening the season; the fixed cost and the sugar in cane left waiting are not.
-
R$25.0Kper stopped hour
at a 400 t/h mill, using the assumptions of the calculator below.Illustrative
-
12non-workable days
with more than 10 mm of rain between September and March, in an average Zona da Mata season (satellite estimate, 2004 to 2024).
-
5systems
usually hold the data of a single operation: weather station, weighbridge, laboratory, ERP and the field spreadsheet. They rarely talk to each other.
Revenue from sugar and ethanol per tonne crushed. This is not the price paid for the cane, which under Consecana is close to R$ 150/t.
Adjust assumptions
Cost of one hour of downtime
R$25,000
Cost of one day of downtime (24 h)
R$600,000
- not recovered 15%
- fixed cost 10%
- recovered later
The calculation
400 t of cane/h × R$250 = R$100,000 of revenue per hour
R$100,000 × (15% + 10%) = R$25,000 per hour of downtime
R$25,000 × 24 h = R$600,000 per day
Assumption for sugar and ethanol mill
During the season, part of the lost crushing comes back later by extending the season. What does not come back is the fixed cost of the stopped hour, the sugar lost by cane that waits and, at the end of the season, the cane left in the field. For that reason we start from 15% of hourly revenue as loss and 10% as fixed cost. Adjust for your mill.
A rough estimate for order of magnitude. It does not replace a diagnostic with your own data.
How we work
We start with an analysis of the data your operation already has, under a confidentiality agreement. Implementation only happens if that analysis shows a gain.
-
Phase 14 to 6 weeks
Diagnostic
We analyze one or more seasons of your history: weather, crushing, stoppages and quality.
What you receive
- Where the operation loses hours and raw material
- Estimated gain in R$, with open assumptions
- Data inventory: what exists, where it is, what is missing
-
Phase 26 to 12 weeks
Field test
We run the forecast on part of the operation, with the success criterion agreed beforehand, and compare it with what actually happened.
What you receive
- Daily forecast for the chosen areas
- Forecast against actual, week by week
- Model tuning together with the field team
-
Phase 3ongoing
Implementation
We integrate with the systems you already use and extend it to the whole operation.
What you receive
- Integration with weighbridge, laboratory and ERP
- Dashboards and alerts for each role
- Results tracked every season
Rain and agricultural operations in Pernambuco: 20 years of data
An Agnaris study on the relationship between rain, harvest days, crushing and cane quality in the 43 municipalities of the Zona da Mata, using data from 20 seasons.
- Season
- 2023/24
- Average rain
- 1,242 mm
- Non-workable days
- 15 days
Daily rain estimated by satellite (CHIRPS, University of California, Santa Barbara), averaged per municipality and checked against 12 ANA rain gauges. Non-workable day: more than 10 mm of rain between September and March.
Read about the studyTalk to the team
Tell us what your operation produces and what data it already has. The first conversation is with the technical team.